Definition of headings in the tables below (each row/line relates to a specific year):
• No. of Trades – total number of trades
• Long – number of long positions
• Cash – number of hold cash positions
• Short – number of short positions
• Avg. Trading Period Gain – the average percentage gain of the profitable trades
• Avg Trading Period Loss – the average percentage loss of the nonprofitable trades
• No. of Gain Periods – the number of trades that were profitable
• No. of Loss Periods – the number of trades that were nonprofitable
• Largest Trading Period Gains – the largest percentage profitable trade
• Largest Trading Period Losses – the largest percentage nonprofitable trade
• Yearly Return – percentage sum of of all profitable and nonprofitable trades
Special Note: Short sell positions (shown in the below tables) can be replaced with the inverse fund ProShares Short QQQ (PSQ) (-1x). PSQ seeks a return that is -1x the return of an index or other benchmark (target) for a single day, as measured from one NAV calculation to the next. Other inverse and leveraged Nasdaq-100 ETFs can be found on here.
Both systems — (1) Long/Short & Long/Short/Cash Models, and (2) Aggressive & Moderate Models were running simultaneously in Year 2024. We decided to end the Aggressive and Moderate Models at the end of Year 2024, and continue with the Long/Short & Long/Short/Cash Models. Through extensive backtesting, the Long/Short & Long/Short/Cash Models are producing higher returns using the new and improved mechanical rules-based system.
Long/Short Model
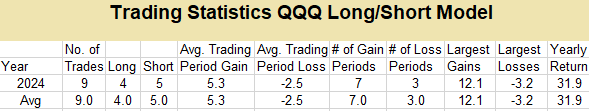
The Long/Short model began on January 1, 2024.
Long/Short/Cash Model
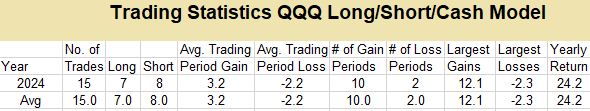
The Long/Short/Cash model began on January 1, 2024.
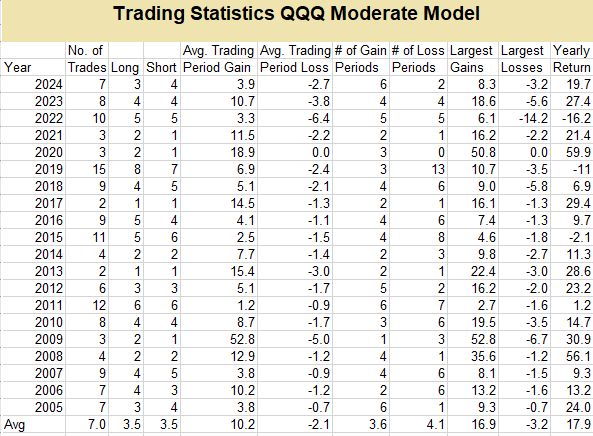
We discontinued the Aggressive and Moderate Models on December 31, 2024. Below are the statistical results.
Aggressive Model

Moderate Model

|