Year 2025 YTD Returns (Updated: 04/04/25): Our current trading signal for QQQ is up +7.11% for both the Long/Short Model and the Long/Short/Cash Model. Our overall returns for 2025 stand at +2.93% for the Long/Short Model, and +4.26% for the Long/Short/Cash Model, outperforming the buy-and-hold strategy, which is at -17.32%. Our returns are based on 'real-time' applications of the trading environment for QQQ and are not hypothetically generated after the fact. We continue to lead all other QQQ advisory services.
Year 2024 Returns: Our members profited +31.9% in the Long/Short Model, and +24.2% in the Long/Short/Cash Model. The buy-and-hold strategy returned +24.8%.
Both systems — (1) Long/Short & Long/Short/Cash Models, and (2) Aggressive & Moderate Models were running simultaneously in Year 2024. We decided to end the Aggressive and Moderate Models at the completion of Year 2024, and continue with the Long/Short & Long/Short/Cash Models. Through extensive backtesting, the Long/Short & Long/Short/Cash Models are producing higher returns using the new and improved mechanical rules-based system.
Detailed Trades of our Track Record can be view by site visitors in both Excel and PDF format.
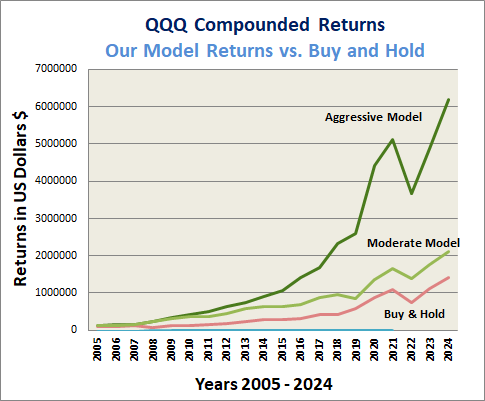
Performance (Years 2005-2024): Our service has an outstanding long-term track record. Our Compounded Annual Growth Rate (CAGR) Results are: +22.9% Aggressive Model, and +16.5% Moderate Model, whereas the buy-and-hold strategy is +14.2%.
Detailed Trades of our Track Record can be view by site visitors in both Excel and PDF format.
Our performance returns are independently verified by TimerTrac. |
As shown on the chart below, a member who traded using our Aggressive Model and started with $100,000 on January 1, 2005 to the end of 2024, would have increased their savings to $6,186,588. For the same time period, the buy-and-hold strategy of investing would have only increased to $1,412,776.
The performance bar chart and table below display our overall results from Years 2005 through 2024:
System Performance Chart |
Model Performance Table
Review our Track Record |


|